Getting Started with Lyntest
Welcome to Lyntest, the easiest way to run content-focused A/B tests on your Shopify store.
This guide walks you through creating your first experiment in just a few steps.
1. Install the App
- Go to the Shopify App Store and install Lyntest.
- Once installed, Shopify will redirect you to https://app.lyntest.com.
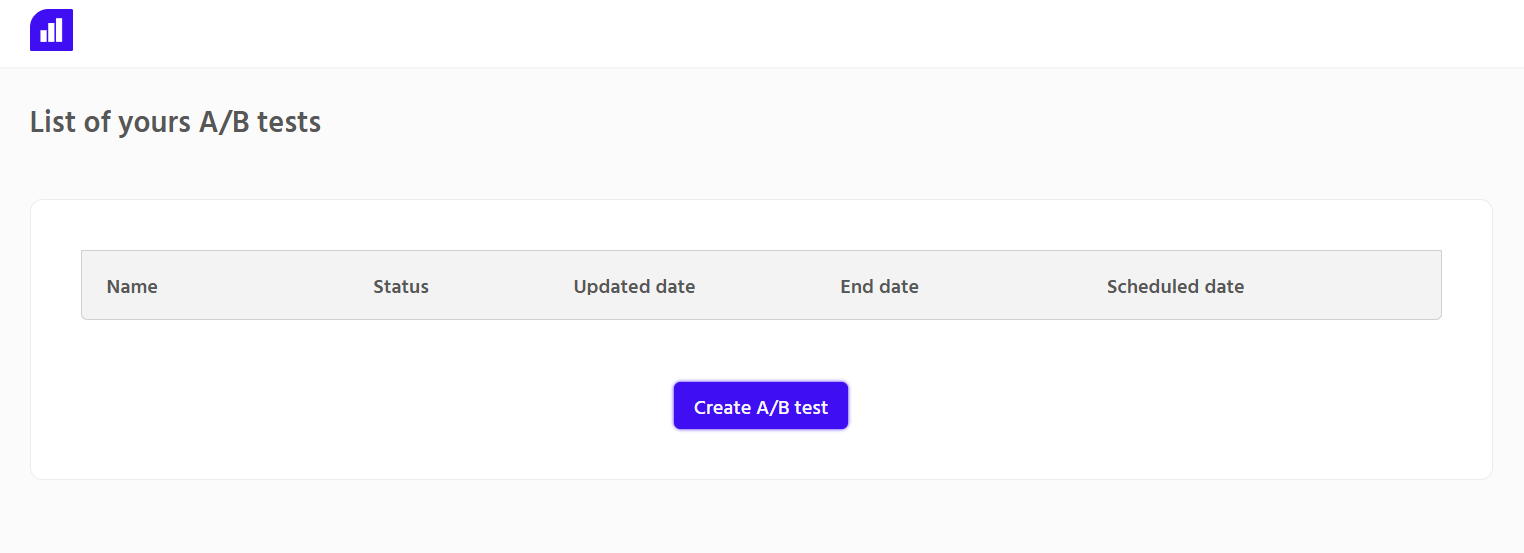
Click “Create A/B Test” to start your first test!
2. Create an A/B Test
-
A/B test name :
Enter a name for your test.
-
A/B test duration
Choose how long your test will run (between 1 and 30 days).
We recommend running your test for at least 15 days to ensure statistical significance. -
Schedule
You can schedule your test to start later by selecting a specific launch date and time.
tipThe “End date” label appears in both the Duration and Schedule sections.
It indicates the date your test will end. -
Theme
Select the theme where the test will run.
importantFor your first selection, you’ll see this message :

You need to install the extension on your theme.
-
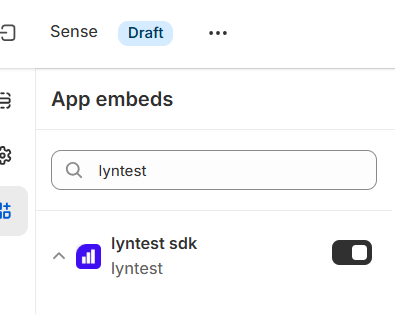
(1) Click the link, this will open Shopify.

-
(2) Make sure lyntest sdk is checked on the left side.
-
(3) Then click Save (top-right corner).

-
(4) Close the tab, return to the A/B Test page, and click the button:

If the extension was installed correctly, both the link and button will disappear.
-
-
Add a variant and set traffic split

Once you’ve added a variant, you can define the traffic split between versions.In the example above :
- Control : 40% of visitors will see the original store version.
- Variant : 60% will see the modified version.
3. Edit the Variant
If your store is password-protected, please log in before continuing.
Next to “Variant”, you can edit or delete it:

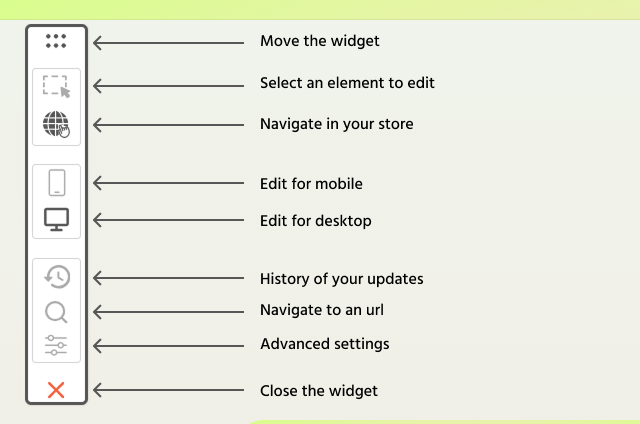
Clicking Edit redirects you to your store with the Lyntest editor open:
Making changes
You can select and modify any element on your store.
All changes are saved automatically.
When finished, click the red cross to close the editor.
4. Launch your test
At the bottom of the page, click “Launch Test.”
The test status at the top will change to Live.
For scheduled tests, we’ll automatically start the test at the defined date and time.
Your test is now live ! 🎉🎉🎉
5. Analytics
Variant comparison

This table allows you to compare performance between the Variant and the Control.
By default, four columns are displayed: Visitors, Add to cart rate, Conversion rate, and Revenue per visitor.
Uplift is shown in green for each metric: add to cart rate, conversion rate and revenue per visitor.
It represents the estimated percentage improvement of the variant over the control, based on the Bayesian model (not a simple ratio).
If you would like to see the detailed analytics, click the toggle switch at the top.
Variant comparison - details
 The detailed analytics view adds several additional columns to the table: Add to cart, Sales, Orders, and Average Order Value.
Sales calculation uses Net Sales : the amount paid by customers after discounts, excluding taxes and shipping.
We don't subtract removals because we measure user interest, not final sales. An "Add to Cart" proves the variant was effective, even if external factors (like shipping costs) led the user to change their mind. This prevents "false negatives" in your data.
How to read your results ?
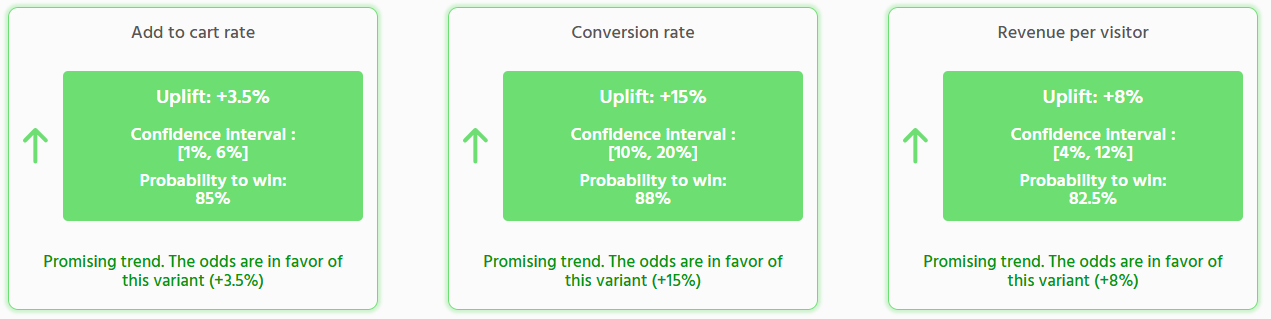
Each card (Add to cart rate, Conversion rate, Revenue per visitor) compares your Variant to your Control, using three numbers.
The three numbers
Uplift How much better or worse the Variant performs than the Control, in relative terms. It is your best estimate so far. Example: +10% on a 2% conversion rate means the Variant converts at 2.2%, not 12%.
Confidence interval [Lower, Upper]
The range where the real effect most likely is. There is a 95% chance that the true uplift is between these two numbers.
- Lower is the worst realistic case.
- Upper is the best realistic case.
Example: [+3%, +21%] means the Variant is probably between 3% and 21% better than the Control.
Probability to win The chance that the Variant is truly better than the Control.
- 50% means a coin flip: no idea yet.
- Close to 100%: the Variant is very likely better.
- Close to 0%: the Variant is very likely worse.
So, is my test good?
Start with the confidence interval, it is the most reliable signal.
| What you see | What it means | What to do |
|---|---|---|
Both numbers are positive, e.g. [+3%, +21%] | Positive trend. Even in the worst case, the Variant is ahead. | The Variant is looking good. |
Both numbers are negative, e.g. [-21%, -3%] | Negative trend. Even in the best case, the Variant is behind. | The Variant is looking worse than the Control. |
The range crosses zero, e.g. [-10%, +20%] | Inconclusive. The Variant could be worse or better. | Keep the test running. |
The probability to win confirms what the interval says:
- A high probability (90% or more) with a positive interval is a strong signal.
- A probability in the middle (between 20% and 80%) means there is no clear difference yet.
- A low probability (10% or less) with a negative interval means the Variant is likely hurting your results.
Sometimes the probability looks encouraging (for example 85%) while the interval still crosses zero. That is a promising start, not a proven result. Wait for the interval to move away from zero before drawing conclusions.
Why the numbers move so much at the beginning
With only a few add to carts or orders, a small bit of luck can swing the results a lot. That is why the interval is wide at the start, and why you may see "Trends visible. Reach 100 add to carts to confirm results."
The more visitors your test gets, the narrower the interval becomes and the more you can trust the uplift. Do not stop a test just because the first numbers look good or bad.
Multi-Page Testing
If you edited a page that isn’t a product page, Lyntest will show your overall store performance.
If you edited a product page, Lyntest will show its individual performance.
You edited the home page, product page 1, and product page 2 in a same test.
Analytics will display:
- Overall store performance
- Product page 1 performance
- Product page 2 performance
Users assigned to the Variant will remain in that group across all pages. The same applies to users assigned to the Control."